Horizon Cloud Next-Gen Monitoring with Workspace ONE Intelligence
In this walkthrough, we’re going to show you how to access and navigate the Horizon Cloud Next-Gen Monitoring dashboards, how to create customized dashboards and reports based on Horizon data within Workspace ONE Intelligence. We will also showcase how experience scores for virtual environments are calculated with an add-on called DEEM for Horizon.
Overview
- Before you begin
- How to access Horizon Cloud Next-Gen Monitoring console in Workspace ONE Intelligence
- Predefined Horizon Cloud Next-Gen Monitoring dashboard
- Create custom dashboard for Horizon Cloud Next-Gen
- Create custom report for Horizon Cloud Next-Gen
Horizon Cloud Next-Gen integration ingests and displays Horizon analytics in a centralized location in Workspace ONE Intelligence. Once the monitoring data and metrics are pulled into Intelligence you can create dashboards and reports to view and analyze the health of your Horizon deployment.
Before You Begin
In order to perform the full end-to-end make sure you have the following:
- An active VMware TestDrive account. More info here.
How to access Horizon Cloud Next-Gen Monitoring console in Intelligence
Open a new Chrome Incognito browser window and navigate to the TestDrive Portal at:
https://portal.vmtestdrive.com
Once you’ve logged in, select Digital Workspace under My Products. Then scroll down to Horizon Cloud, click to expand, and and then select Launch.
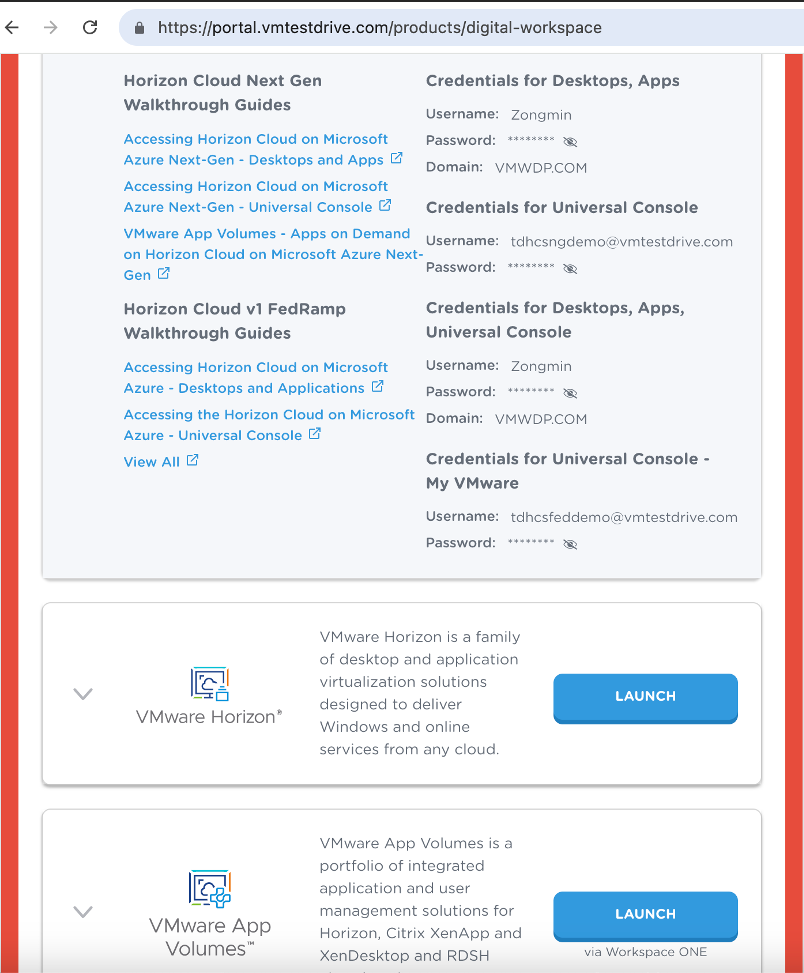
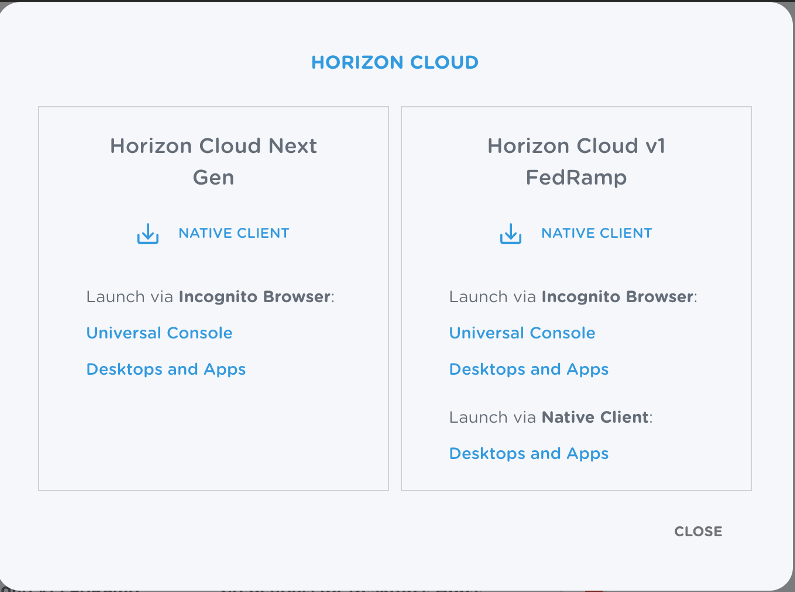
On the pop up menu under Horizon Cloud Next Gen, open Universal Console **in a new incognito window or private browser**
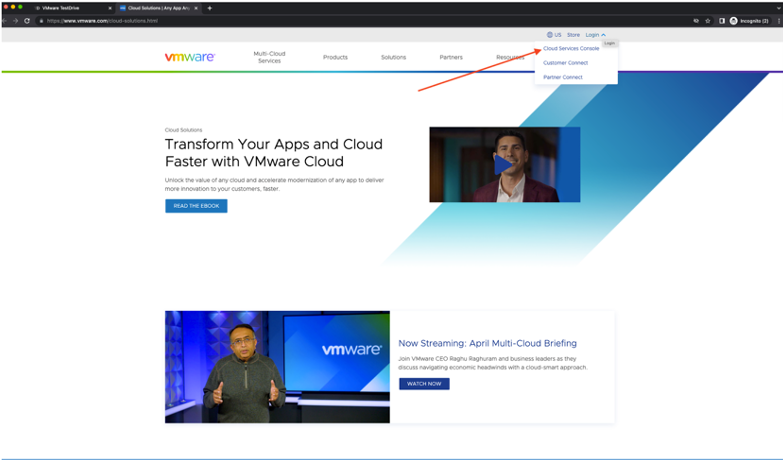
Expand the login menu and click on Cloud Services Console
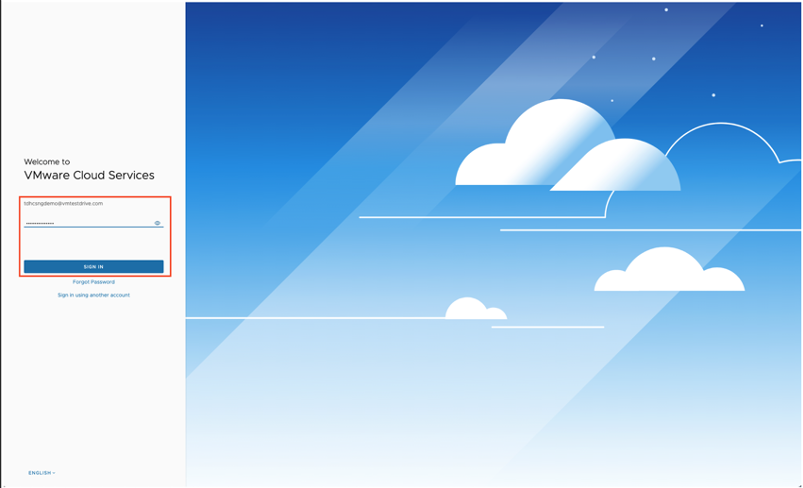
Enter credentials s are found in the Horizon Cloud Service section of the TestDrive Portal.
This brings you to the initial Cloud Services webpage. Click on Workspace ONE Launch Service Button.
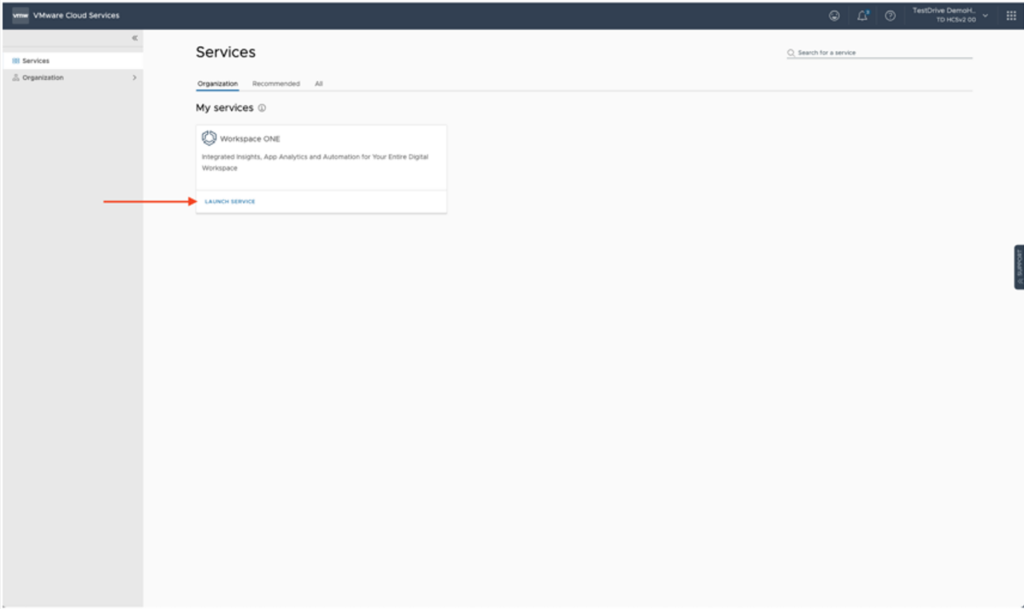
This brings you to the Workspace ONE page.
Accessing Predefined Horizon Cloud Next-Gen Monitoring dashboard
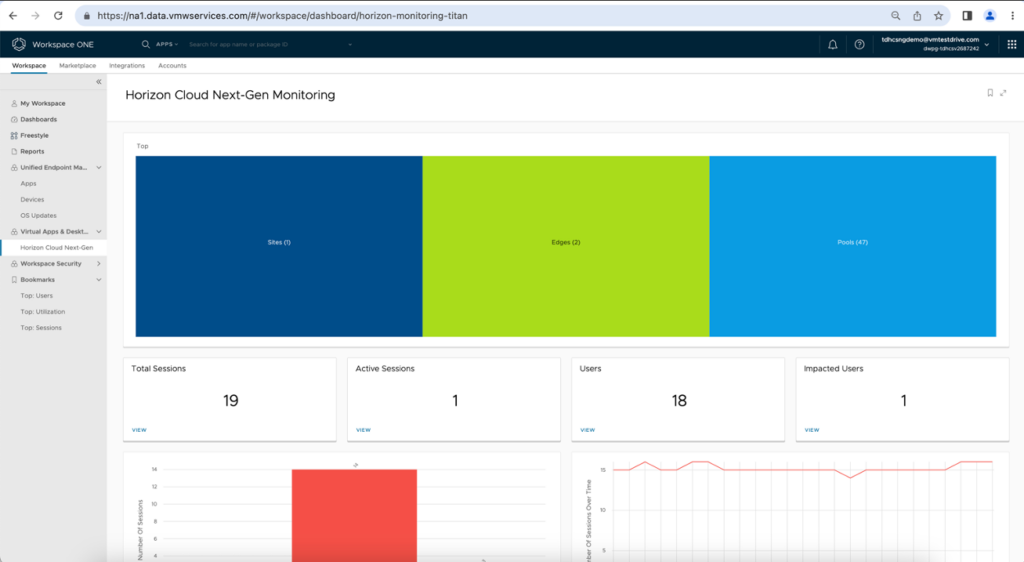
Find dashboards for your Horizon integration in Workspace ONE Intelligence at Workspace > Virtual Apps & Desktops > Horizon Cloud Next-Gen.
- The overview dashboard for Horizon Cloud Next-Gen Monitoring shows available Sites, Edges, and Pools.
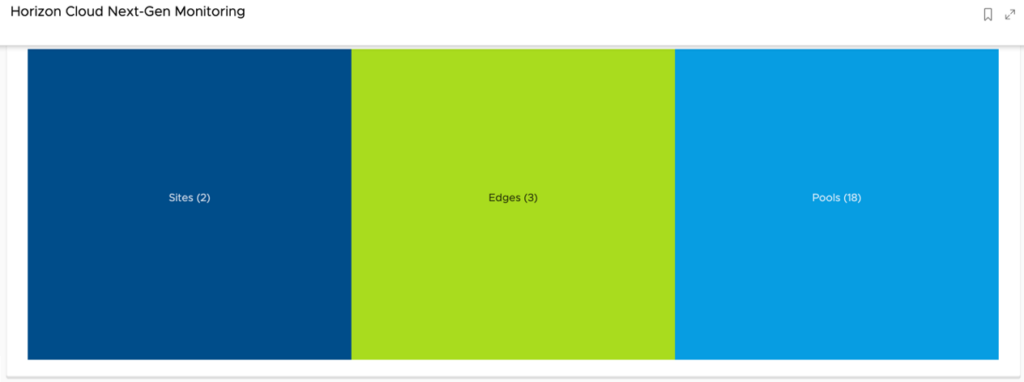
In screenshot above, there are 2 sites, 3 Edges and 18 Pools.
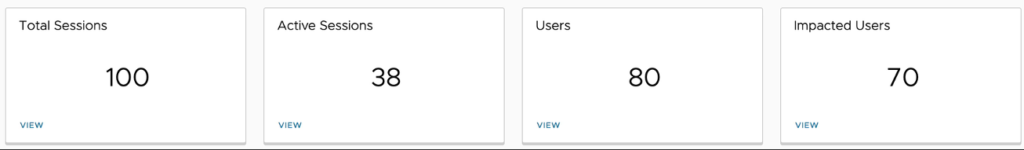
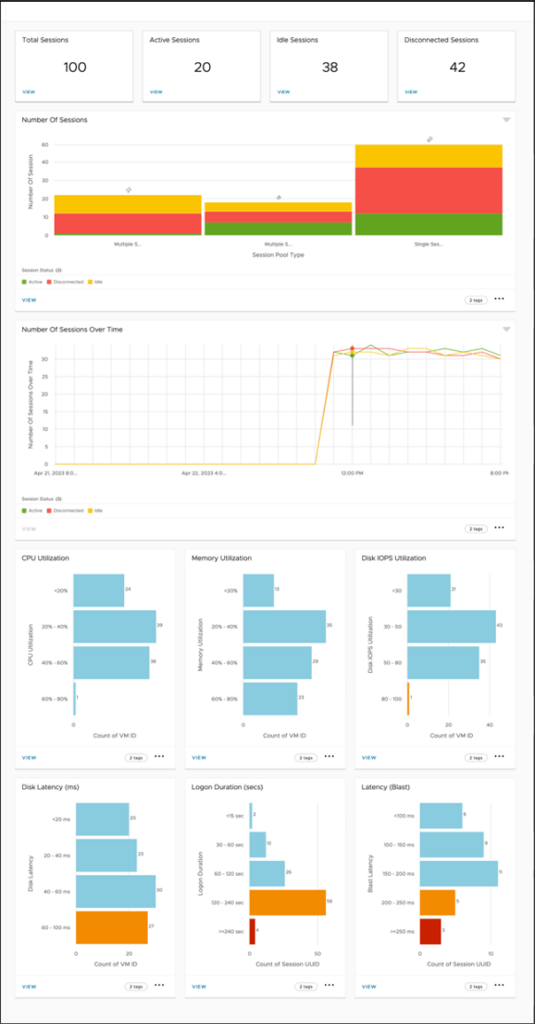
- The key metrics for sessions and users on the overview dashboard include Total Sessions, Active Sessions, Users, and Impacted Users. You could click on “VIEW” link to get the detailed list of sessions and users related to each metric.
- Intelligence displays more Horizon Cloud Next-Gen data in the listed widgets located under the overview.
- Sessions – This widget displays active, idle, and disconnected sessions broken down across all deployments, including Multiple Session Desktop sessions, Single Session Desktop sessions, Multiple Session Application sessions.
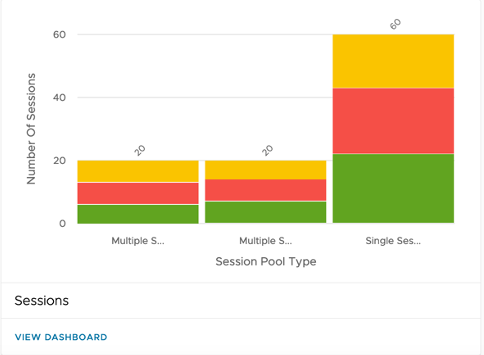
You can click “VIEW DASHBOARD” link to drill down into this dashboard, which will give you detailed information of session metrics.
When you drill down into a specific Site, Edge or Pool at the tree map, this widget will be updated accordingly to show sessions for the infrastructure that you click.
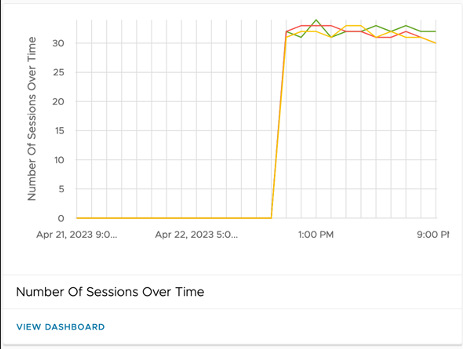
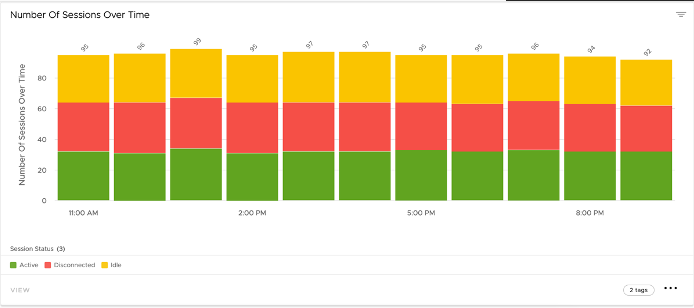
- Sessions Over Time – This widget displays active, idle, and disconnected sessions trending over time. Clicking “VIEW DASHBOARD” will drill down into Sessions dashboard. Within Sessions Dashboard, you could customize the time range of the the “Number of Sessions Over Time” widget, which will give you the flexibility to see sessions trend during selected time range.
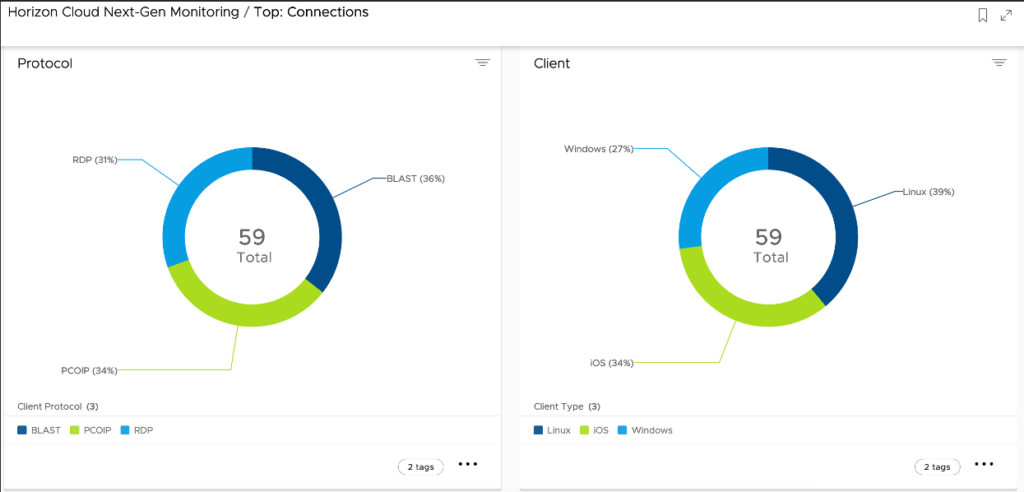
- Connections – This widget breaks down the protocols, client types, and access types by active user connections.
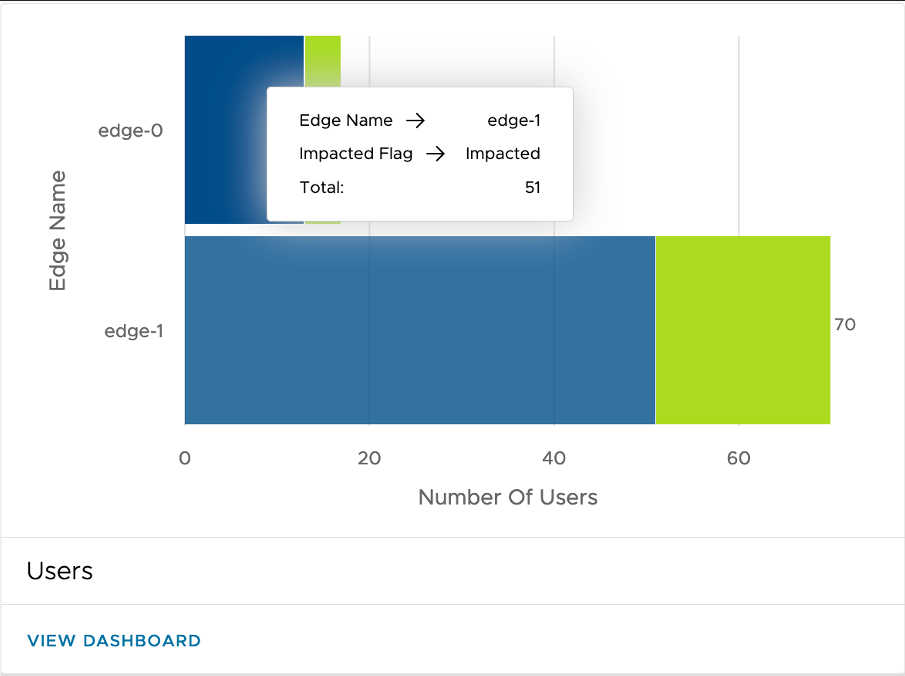
- Users – This widget displays distributions of users against Edges or pools, and it lists users impacted by protocol, latency, and logon performance.
- Utilization – This widget shows overall resource use of your Horizon Cloud Next-Gen deployments.
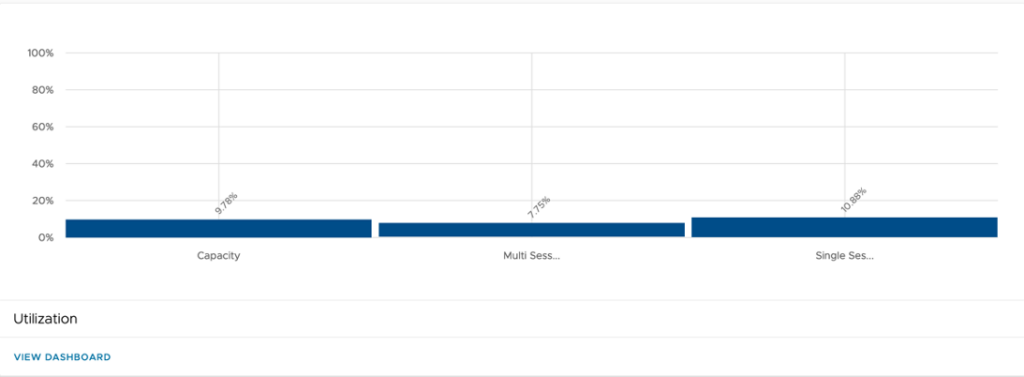
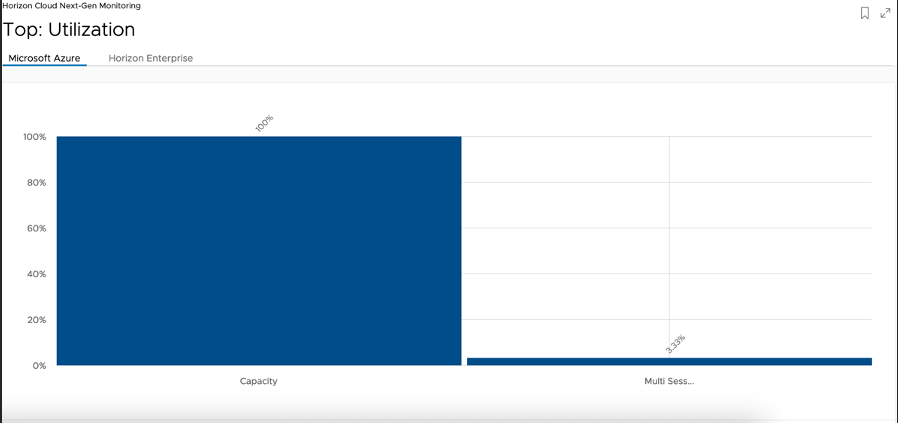
By clicking “VIEW DASHBOARD” you will see the resource utilization grouped by provider types.
Create custom dashboard and reports based on Horizon Cloud Next-Gen data in Intelligence
The Horizon Cloud Custom dashboards allow you to create your own widgets using Horizon data. Admins can share these dashboards with colleagues and other business teams.
Custom dashboard for Horizon Cloud Next-Gen
You can create custom dashboard, and create widgets based on your Horizon data and share it with others.
To create a custom widget
Click “ADD WIDGET -> Custom Widget”
Select Horizon Under “CATEGORY”, and choose one of the sub-category to create custom widget.
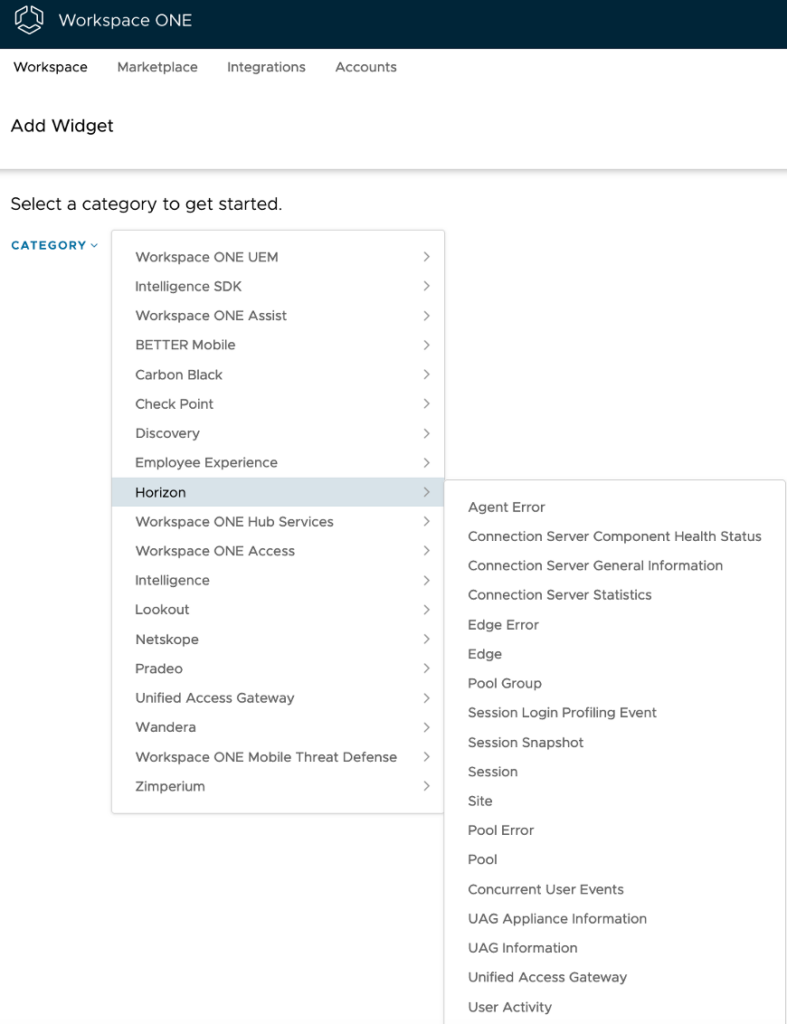
Check Workspace ONE Intelligence Dashboard documentation for how to use Dashboard in general.
Custom report for Horizon Cloud Next-Gen
You can create custom report based on your Horizon data and share it with others.
- Choose Reports under “Workspace”
- Click “Add -> Custom Report” under Reports page
- In Add Report page, select Horizon Under “CATEGORY”, and choose one of the sub-categories to create custom widget.
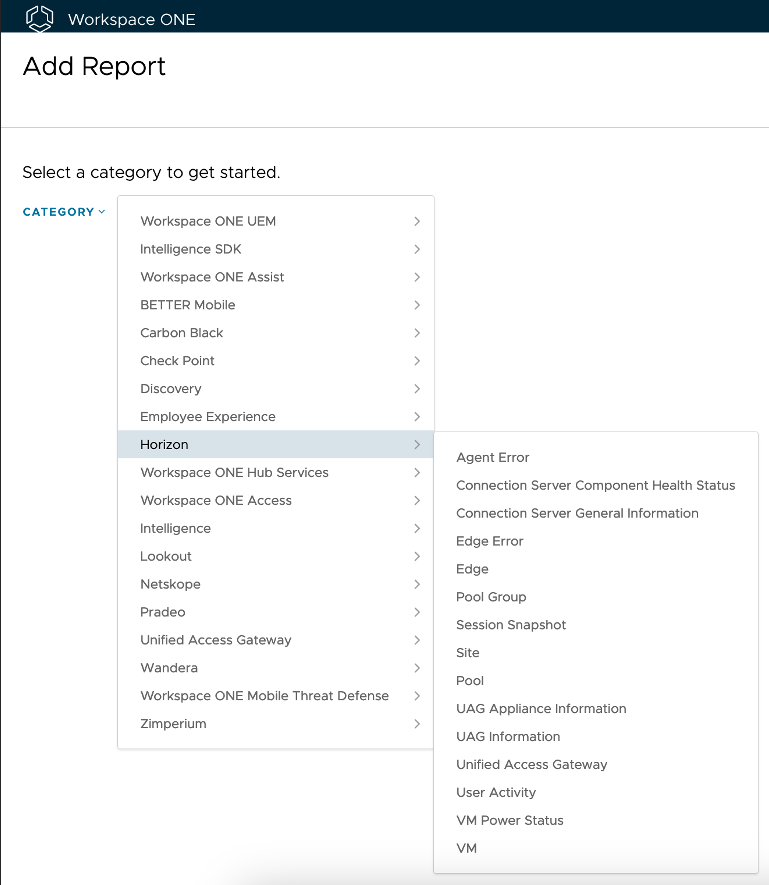
Check Workspace ONE Intelligence Reports for generic reports usage information.