Using Sensors for sampling the DEEM Telemetry settings
Digital Employee Experience Management (DEEM) relies heavily on telemetry to deliver actionable insights into endpoint health, application performance, and overall user experience.
Within the Omnissa solution, DEEM data can be collected through two primary integration modes:
– UEM Mode
– Horizon Mode
In addition, there is a separate configuration option to enable Application Network Data, which is controlled via a registry key and is not enabled by default. Integration Mode Recommendations:
– For UEM-managed devices, the UEM integration mode is the recommended and supported approach.
– For Horizon-managed environments, the Horizon integration mode should be used.
Regardless of the integration mode, it is strongly recommended to enable Application Network Data, as it significantly enhances visibility into application connectivity and performance.
To sample the Values with Workspace ONE UEM the following can be done.
Get the Integration Mode(UEM vs. Horizon) :
To create a new Sensor in UEM go to Resources and Scripting and Select Sensors.
On the App Button a new Sensor can be created.
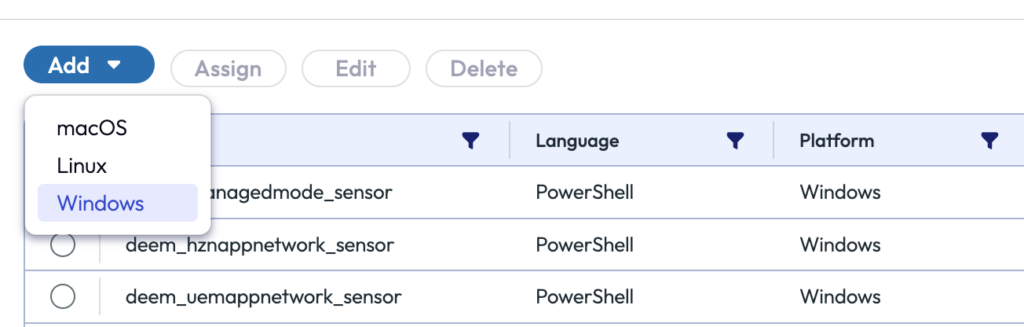
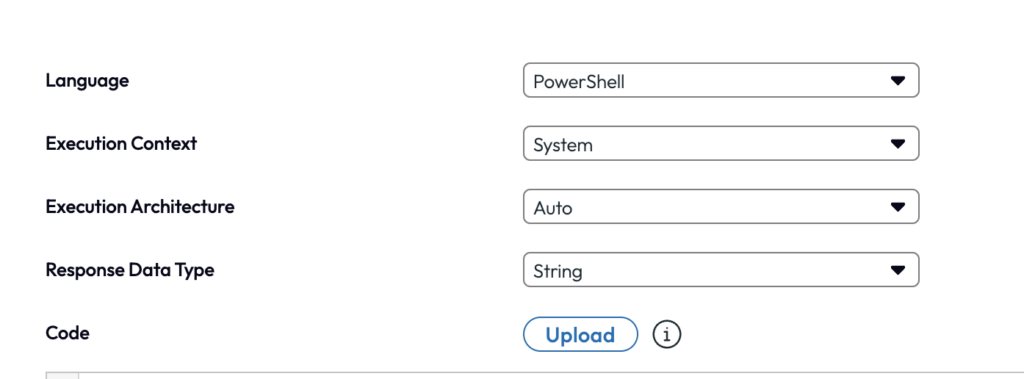
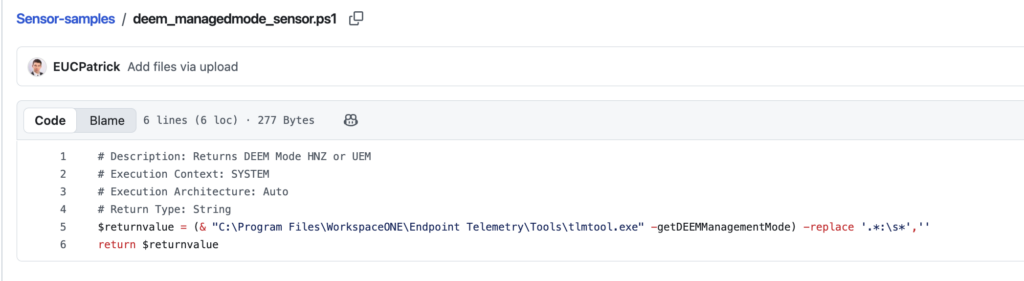
Upload the following sensor to UEM :
https://github.com/EUCPatrick/Sensor-samples/blob/main/deem_managedmode_sensor.ps
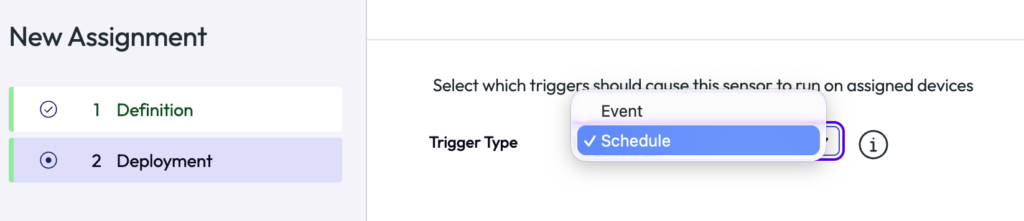
Assign the Sensor the the Smartgroup and define the Deployment, best would be the Schedule Trigger.
done, now on the next Sample we see the values and can get the reports and Dashboards in Intelligence build.
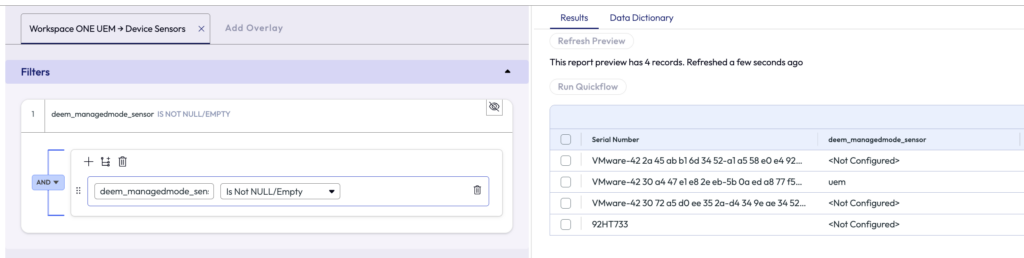
the following sensor Values are expected to be returned:
<Not Configured> -> default means the same then uem
uem -> Data will be sent for the UEM Device to Intelligence
Horizon -> Data will be sent for the Horizon Session Device to Intelligence
To Change the Mode to UEM simply execute the Following script:"C:\Program Files\WorkspaceONE\Endpoint Telemetry\Tools\tlmtool.exe" -setDEEMManagementMode uem
To Change the Mode to Horizon simply execute the Following script:"C:\Program Files\WorkspaceONE\Endpoint Telemetry\Tools\tlmtool.exe" -setDEEMManagementMode horizon
In Intelligence we can see the Device Sensor and the Values:
Get the App Network Data Status:
The basic of the App Network integration are documented here: https://docs.omnissa.com/bundle/Intelligence/page/IntelAppNetwork.html
Follow the process above the for the creation of the sensor, to cover both UEM and Horizon both sensor are available on GitHub.
Upload the following sensor to UEM :
https://github.com/EUCPatrick/Sensor-samples/blob/main/deem_uemappnetwork_sensor.ps
in case the integration is Horizon and want to use the Horizon Integration Mode please use the following Sensor:
https://github.com/EUCPatrick/Sensor-samples/blob/main/deem_hznappnetwork_sensor.ps1
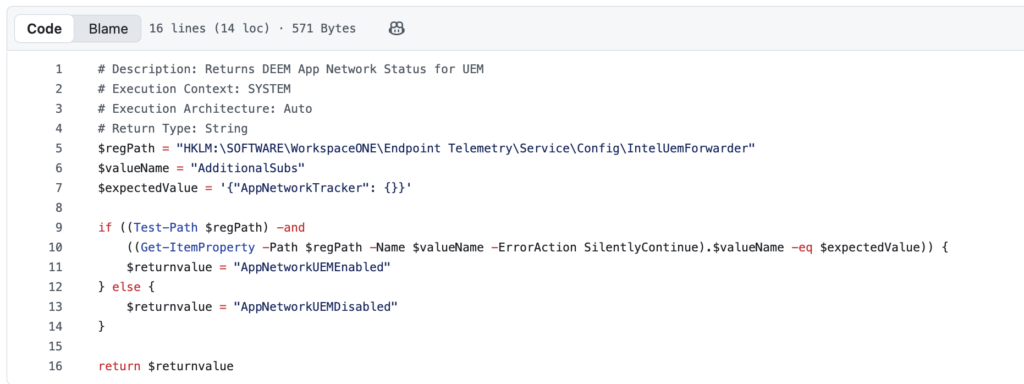
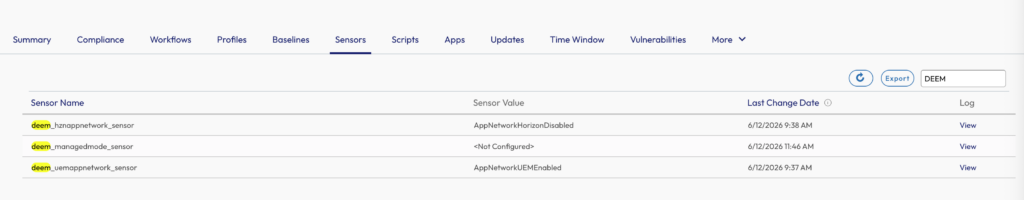
The following sensor Values are expected to be returned:
AppNetworkUEMEnabled -> UEM Integration & Feature is enabled
AppNetworkUEMDisabled -> UEM Integration & Feature is disabled
AppNetworkHorizonEnabled -> Horizon Integration & Feature is enabled
AppNetworkHorizonDisabled -> Horizon Integration & Feature is disabled
to enable this App Network data ensure the Script from Customer Connect is used to Enable it: https://customerconnect.omnissa.com/downloads/details?downloadGroup=WSONE-DEEM&productId=1579&rPId=118908
In UEM we can see the Values then in the sample:
Get the App Network Status updated we can also use a Script via UEM. the Script can and run it based on the Value of the Sensor with a Freestyle Flow.
By leveraging UEM Sensors and Workspace ONE Intelligence, organizations gain a simple yet powerful way to validate these configurations at scale. This approach not only helps confirm alignment with best practices, but also enables proactive reporting, faster troubleshooting, and more informed decision-making.
vExpert, blogger and VMware & Omnissa champion. Worked 10 years as a Architect for a partner before joining VMware in 2017. Moved to Omnissa in 2024.